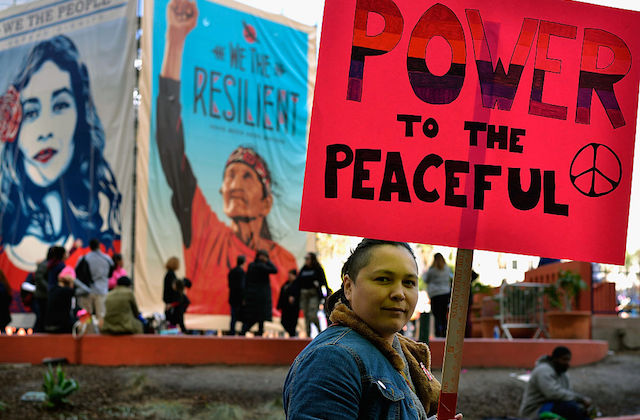
A new survey shows that Native American women experience discrimination at higher levels than other groups of women living in America.
Released today (December 11), “Discrimination in America: Experiences and Views of American Women” is a collaborative effort of NPR, the Robert Wood Johnson Foundation and the Harvard T.H. Chan School of Public Health. Researchers polled 3,453 adults between January 26 and April 9 to find out how women experience various types of discrimination in the United States.
Overall, 68 percent of the women polled said they believe people who identify as women are discriminated against in 2017 America. But the prevalence of this belief varies widely by racial and ethnic group, as well as by sexual orientation and gender identity. Eighty-seven percent of Black women agree that discrimination against women exists. Among Native American women, 79 percent agree. White women (67 percent), Latinx women (66 percent) and Asian American Pacific Islander women (52 percent) are less likely to agree. And 84 percent of LGBTQ women agree, versus 68 percent of women who don’t identify that way.
Twenty-one percent of all women polled said that either they or a female family member had been sexually assaulted. That jumped to 37 percent when asked about harassment. The researchers note that the poll was conducted before the launch of the current discussion around sexual harassment and assault charges, and that the numbers varied widely by age, with young people reporting this type of discrimination at much higher levels than older respondents.
But the biggest differences are revealed in the breakdown of the types of discrimination that women have personally experienced—and the things they do to avoid it, from not calling the police when they need help to avoiding doctor appointments.
In most categories, Native American women were more likely to experience discrimination than the other groups of women polled, including LBGTQ women of all races. Black women were a close second in most categories. The NPR-created chart below dives into the numbers.
{{image:2}}
Read the full report here.